• We are now running on a new, and hopefully much-improved, server. In addition we are also on new forum software. Any move entails a lot of technical details and I suspect we will encounter a few issues as the new server goes live. Please be patient with us. It will be worth it! :) Please help by posting all issues here.
  • The forum will be down for about an hour this weekend for maintenance. I apologize for the inconvenience.
  • If you are having trouble seeing the forum then you may need to clear your browser's DNS cache. Click here for instructions on how to do that
  • Please review the Forum Rules frequently as we are constantly trying to improve the forum for our members and visitors.

Gas Price Pattern

eye95

Well-known member
Joined
Jan 6, 2010
Messages
13,524
Location
Fairborn, Ohio, USA
And the pattern continues...

I bought gas a few days ago at $3.64, thinking that, based on the pattern, we were due for about a 25 cent increase. I thought I was wrong. Prices dropped a few cents each day, getting down to $3.58.

Nope. I was right. This morning, on the way to the base, $3.58. About two hours later, on the way home, $3.86, up 28 cents.

Again, patterns like this do not occur in complex systems. Entropy rules.

Where is this pattern coming from?

That there is a pattern is not bad. I can time my purchases pretty well lately. What is bad is that the pattern is for a few small drops followed by a huge increase. If it is designed (I don't know), it is a wonderful design to get folks to go along sheepishly with increasing prices.

The next jump should take us to right around $4. The jump after that should put us in the $4.10 to $4.15 range.
 

()pen(arry

Regular Member
Joined
Nov 15, 2010
Messages
735
Location
Seattle, WA; escaped from 18 years in TX
A general pattern of gradual price decrease, due to tit-for-tat competition with nearby retailers, followed by a sudden, substantial increase due to supplier price increases, all repeated in an endless cycle, is to be expected in any consumer-marketed supply chain system. Even were supplier price over time a perfect square wave, you would see the consumer price decay gradually, and jump suddenly, as in a reverse saw-tooth wave. This is characteristic of market pricing in any supply chain-based industry.

Whether you've observed an anomalous, recurrent, and predictable timing to this to-be-expected "pattern" is a separate topic, entirely. I assure you, this pattern has occurred, with little variation, for far longer than you or I have been alive. It's likely you are simply more sensitive to it now that you've noticed it, and I suspect that your perception of predictable timing is a subjective observation attributable to confirmation bias.
 

Redbaron007

Regular Member
Joined
Sep 10, 2011
Messages
1,613
Location
SW MO
Hey eye95......I think that is a pattern in your area.

We were down to $2.99/gal until the first week of January. After that Gas rose $.20/gal, then within a week rose a dime, then a couple of weeks later it topped out at $3.59/gal. Within a 6 week or so period, we went from $2.99 to $3.59/gal. We have held that spot now for about a week. This morning, it went down $.02...it is $3.57/gal.

There a lot of variables that go into the pricing of gasoline. Just a few consideration on the price of oil; refining issues (capacity), potential new taxes, supply v demand and different blends; just to name a few. Some cities have several different blends to ship, IIRC, St Louis has at least three blends (winter, spring & summer/fall). Our prices here have a bearing on what is being pumped through the pipelines here. We sit on three pipelines that help provide fuel for the upper Midwest (including Chicago)...when they are shoving their multiple different blends to CGI, our price usually goes up because the fuel running through the pipes are bound for CGI, not here.
 

Tawnos

Regular Member
Joined
Jun 4, 2008
Messages
2,542
Location
Washington
Again, patterns like this do not occur in complex systems. Entropy rules.

Again:
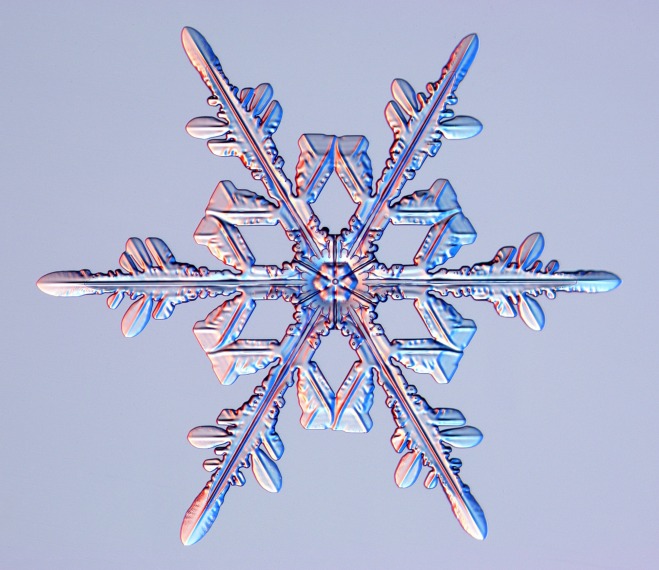
w031224a130.jpg


Care to revise that statement?
 

Tawnos

Regular Member
Joined
Jun 4, 2008
Messages
2,542
Location
Washington
There is a big difference in refining oil into gas and then supplying a market with gas. When compared to refining snow flakes.

His claim is that repeated patterns don't occur in complex systems. I gave an example of a very complex system (a storm cloud) and a pattern that occurs from that system. There's a claim being put forth, yet no evidence to back it.
 

Aknazer

Regular Member
Joined
Mar 6, 2011
Messages
1,760
Location
California
Again:
w031224a130.jpg


Care to revise that statement?

The creation of a snowflake is incredibly simple. But here, have some reading material to understand the physics of why snowflakes are symmetrical. TLDR is that it uses less energy and creates a more stable crystal. Oh and don't forget that "no two snowflakes are the same" bit, so showing a picture of a snowflake falls flat on its face once other snowflakes are introduced.

EDIT: And I'd like you to look at the picture you linked. Tell me, can you spot the issues with it? Because I can and it's not perfectly symmetrical.
 
Last edited:

sudden valley gunner

Regular Member
Joined
Dec 13, 2008
Messages
16,674
Location
Whatcom County
His claim is that repeated patterns don't occur in complex systems. I gave an example of a very complex system (a storm cloud) and a pattern that occurs from that system. There's a claim being put forth, yet no evidence to back it.


Even in that complicated and chaotic storm cloud certain undeniable rules of physics apply.

Austrian school of economist are like the physicists of economy.

Eye, are you not a mathematician? Maybe you could develop a formula for the pattern you see.
 

eye95

Well-known member
Joined
Jan 6, 2010
Messages
13,524
Location
Fairborn, Ohio, USA
OCfM: Your post drew a big ? from me. It prompted me to check the post prior to yours, which I would have routinely ignored. Your point is spot on.

The growing of crystals from individual atoms or from incredibly simple compounds, like water, is NOT a complex system. It will proceed with predictable mathematical precision.

Back to the topic at hand: Some people are reporting that the pattern is unique to my area. Another explains that, after a jump, local market pressures will slowly drop prices until the next jump. That is a reasonable explanation. However, I have not noted that pattern previously. In the past, increases were sometimes small and repeated, while drops were huge and unexpected. Sometimes both kinds of fluctuations were constantly small or randomly large.

I am still left to wonder why this pattern now? Will it continue? It is a pattern that is leading to rapid increase in gas prices. How high will they go? Will they hit the target of $5 for which some have stated a desire?
 
Last edited:

eye95

Well-known member
Joined
Jan 6, 2010
Messages
13,524
Location
Fairborn, Ohio, USA
Even in that complicated and chaotic storm cloud certain undeniable rules of physics apply.

Austrian school of economist are like the physicists of economy.

Eye, are you not a mathematician? Maybe you could develop a formula for the pattern you see.

If I were to gather the actual average daily gas prices in the Dayton area, it would only take a few hours work to do so. I would merely need to find the averages of the days between spikes, 5 to 8 I would say, the amount of the increases, 20 to 30 cents, and the number and size of decreases between spikes. Then I could apply those averages into the future.

If I can overcome the laziness I am feeling about doing so, I might give it a whirl. But I seem to be able to follow and predict the pattern without all that effort. I'll look into it.
 

eye95

Well-known member
Joined
Jan 6, 2010
Messages
13,524
Location
Fairborn, Ohio, USA
I haven't found the data for Dayton yet, but in the process I found a graph for Ohio. The stair-step pattern isn't as stark for the whole State as it has been for Dayton, but it is distinctly there, starting on December 19.

http://www.ohiogasprices.com/retail_price_chart.aspx

On edit: I was able to superimpose Dayton on the Ohio graph. As I said, Ohio data is not as stark as Dayton. The Dayton graph mirrors the Ohio graph. It just has greater declines and more dramatic jumps.

On second edit: My informal observations were specifically for Fairborn, which I suspect is being even more dramatic than Ohio, or even for Dayton. Heck, it could be that Fairborn averages are causing the Greater Dayton numbers to behave more starkly than the Ohio numbers!

I still don't have the daily numbers, just the graphs.

However, I just had a thought. I work for the Exchange. I can probably contact the Express manager and get their complete price history. It mirrors the predominant Fairborn price by regulation. That is how they are required to set their price.
 
Last edited:

sudden valley gunner

Regular Member
Joined
Dec 13, 2008
Messages
16,674
Location
Whatcom County
I bet much of the rise can be traced right back to QE's and the current federal reserve's policies.

I am not great at making graphs, I wonder though how your graphs would compare to QE graphs?
 
Last edited:

eye95

Well-known member
Joined
Jan 6, 2010
Messages
13,524
Location
Fairborn, Ohio, USA
I spoke with the Express manager today. He will send the data to my Exchange email. (He seemed happy to help a fellow Exchanger with a little private research.) I will crunch that data, present the pattern since December 21 (when it seems to have started), and extrapolate it into the future.

Someone else want to handle the other homework assigned? ;)


Sent from my iPad using Tapatalk.

<o>
 

Tawnos

Regular Member
Joined
Jun 4, 2008
Messages
2,542
Location
Washington
The creation of a snowflake is incredibly simple. But here, have some reading material to understand the physics of why snowflakes are symmetrical. TLDR is that it uses less energy and creates a more stable crystal. Oh and don't forget that "no two snowflakes are the same" bit, so showing a picture of a snowflake falls flat on its face once other snowflakes are introduced.
The "no two snowflakes are the same" is something you tell kids, but statistically it's likely that out of the uncounted number of snowflakes that have fallen, two are the same*. The fact is, there's no perfect "pattern" in what eye95 is claiming, just his assertion that repeated cycles of price decreases and increases (by differing amounts, within varying time periods, etc) cannot happen in an entropic system. I understand the physics of snowflake (and other structure arising from entropic systems), and I'm demonstrating that something with a "pattern" or a "structure" can arise from what he's calling an "entropic" system.

EDIT: And I'd like you to look at the picture you linked. Tell me, can you spot the issues with it? Because I can and it's not perfectly symmetrical.
Nor are eye's claims. FFS, you're missing the forest for the trees. The point (the forest) is that an apparent pattern can occur due to a combination of entropic events (the trees).


*
There is 1 mole per 18 grams of water.
1 mole has 6.022 * 10^23 molecules.
According to this, a snowflake has between .001 and .02 grams of water each.
Thus, assuming the middle mass of that range on average (.0105g), there are .0105g/snowflake * 1 mol / 18g * 6.022 * 10^23 molecules / mol = ~3.51 * 10^20 molecules of water per snowflake.

Seems pretty big, right? Well, in a given pound of snow, there are approximately 453.6 g / lb * 1 snowflake / .0105g = 43200 snowflakes. Ten acres of snow ten inches deep is about 226,000 pounds, which is approximately 9.76 * 10^9 snowflakes. Since it's pretty easy to get hundreds of acres of snow that deep in a blizzard, you can see how quickly this scales. At that point, it just becomes a matter of numbers. Enough flakes over enough time will eventually work out to a statistical probability that somewhere, at some point in time, there have been two that are exactly alike. This is helped by the fact water always freezes with bonds at the same angle, but is hindered by the crystal growth occurring differently over different temperature and pressure ranges. Suffice it to say, we live in a big universe, and even on earth, there are a _lot_ of snowflakes.
 

Freedom1Man

Regular Member
Joined
Jan 14, 2012
Messages
4,462
Location
Greater Eastside Washington
The creation of a snowflake is incredibly simple. But here, have some reading material to understand the physics of why snowflakes are symmetrical. TLDR is that it uses less energy and creates a more stable crystal. Oh and don't forget that "no two snowflakes are the same" bit, so showing a picture of a snowflake falls flat on its face once other snowflakes are introduced.

EDIT: And I'd like you to look at the picture you linked. Tell me, can you spot the issues with it? Because I can and it's not perfectly symmetrical.

http://www.abc.net.au/science/articles/2006/11/13/1784760.htm

But in 1988, the scientist Nancy Knight (at the National Center for Atmospheric Research in Boulder, Colorado) was studying wispy high altitude cirrus clouds. Her research plane was collecting snowflakes on a chilled glass slide that was coated with a sticky oil. She found two identical (under a microscope, at least) snowflakes in a Wisconsin snowstorm.


So much more your theory that no two are alike.
 

sudden valley gunner

Regular Member
Joined
Dec 13, 2008
Messages
16,674
Location
Whatcom County
I spoke with the Express manager today. He will send the data to my Exchange email. (He seemed happy to help a fellow Exchanger with a little private research.) I will crunch that data, present the pattern since December 21 (when it seems to have started), and extrapolate it into the future.

Someone else want to handle the other homework assigned? ;)


Sent from my iPad using Tapatalk.

<o>

I look forward to seeing your graph. :)
 

dmatting

Regular Member
Joined
May 25, 2011
Messages
445
Location
Durham, NC
What I find interesting in the graph that Eye links to below is the rates of rise and the rates of fall in the prices. The rates of rise are almost identical and the rates of fall are almost identical as well. If the frequency/period were more stable, this would almost look like an AC rectified charge/discharge profile of a resistively loaded capacitor.

I haven't found the data for Dayton yet, but in the process I found a graph for Ohio. The stair-step pattern isn't as stark for the whole State as it has been for Dayton, but it is distinctly there, starting on December 19.

http://www.ohiogasprices.com/retail_price_chart.aspx

On edit: I was able to superimpose Dayton on the Ohio graph. As I said, Ohio data is not as stark as Dayton. The Dayton graph mirrors the Ohio graph. It just has greater declines and more dramatic jumps.

On second edit: My informal observations were specifically for Fairborn, which I suspect is being even more dramatic than Ohio, or even for Dayton. Heck, it could be that Fairborn averages are causing the Greater Dayton numbers to behave more starkly than the Ohio numbers!

I still don't have the daily numbers, just the graphs.

However, I just had a thought. I work for the Exchange. I can probably contact the Express manager and get their complete price history. It mirrors the predominant Fairborn price by regulation. That is how they are required to set their price.
 

sudden valley gunner

Regular Member
Joined
Dec 13, 2008
Messages
16,674
Location
Whatcom County
I find that the length of time for the decline varies greatly yet the length of time for the rise is fairly close.

I wonder if the initial response is to overvalue the good to money supply and then it settles down to it...I can't find any dates for QE to match Eyes graph, just graphs in general that shows the fiat currency supply rising exponentially.
 
Top